Home » Distributed tracing with Spring Cloud Sleuth and Zipkin
Distributed tracing with Spring Cloud Sleuth and Zipkin
9. May 2024
Introduction
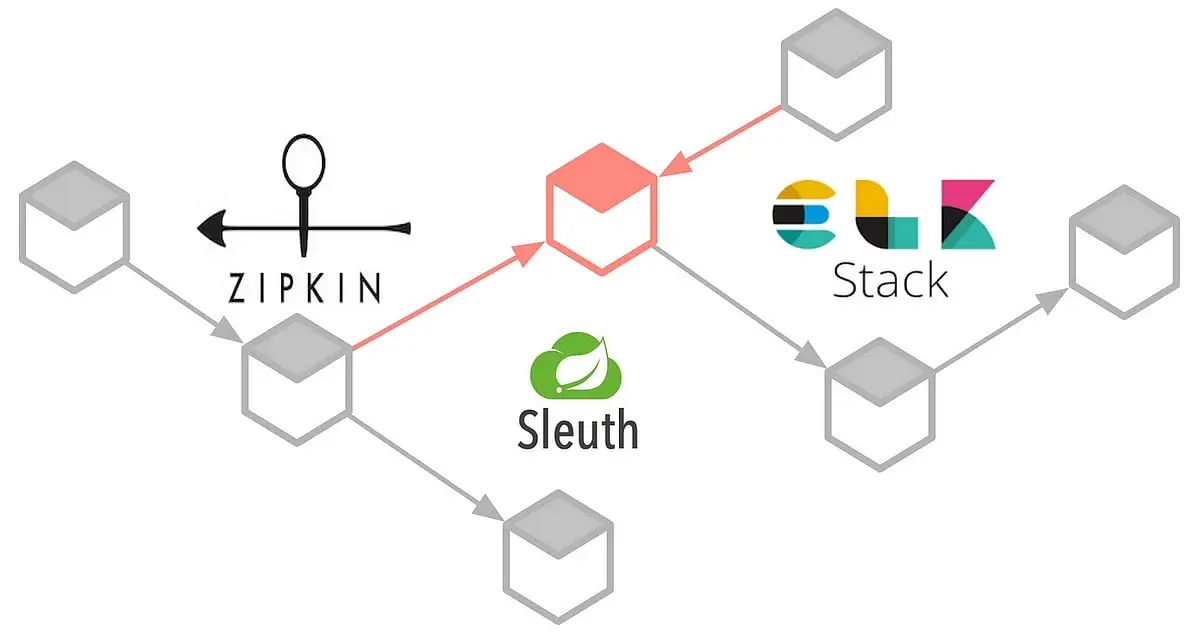
In this article, we are going to explore how we can implement distributed tracing with Spring Cloud Sleuth and Zipkin. In addition, we will examine how to use Spring AOP to trace all methods in the application.
We are going to create two simple services, order-service and payment-service. The order-service will call the payment-service using the RestTemplate library. To make this process observable, we are going to trace all methods calls.
Zipkin setup
As referenced in the Zipkin official documentation, Zipkin is a distributed tracing system, that helps gather timing data needed to troubleshoot latency problems in service architectures.
Setting up Zipkin as a Docker container is very easy. We are going to use the image jaegertracing/all-in-one from DockerHub.
Span data will be sent to Jaeger through port 9411, while the Jaeger UI is reachable through http://localhost:16686/search.
Great! We finished with the first step.
Sleuth configuration in Spring Boot 2.x
It’s time to configure Sleuth and Zipkin in our Spring Boot services running on version 2.7.14 of spring-boot-starter-parent. However, pay attention that Spring Cloud Sleuth is not planned to work with Spring Boot 3. You must migrate to Micrometer Tracing.
The dependencies that we will need are two, spring-cloud-starter-sleuth and spring-cloud-sleuth-zipkin. Our pom.xml file looks the same for both of our services.
Next, we add the following properties in the application.properties file. Shown below is the order-service. However, the payment-service configuration looks similar except for the server.port which is 8081.
The property spring.zipkin.baseUrl configures the base URL of the Zipkin server where the traces will be sent. In this case, it’s set to http://localhost:9411, meaning that the application will send its traces to a Zipkin server running locally on port 9411.
The property spring.sleuth.sampler.probability configures the sampling probability for traces. Sampling is the process of determining whether a particular trace should be recorded or not. A value of 1 means that all traces should be recorded (100% sampling rate), while a value of 0 means that no traces should be recorded (0% sampling rate).
I created some simple controllers in both services. The order-service serves POST requests in the endpoint /order and the payment-service serves POST requests in the endpoint /payment. During this calls, a couple of public and private methods are called inside each service.
If you want to have a look at the code, please refer to the repository in Github.
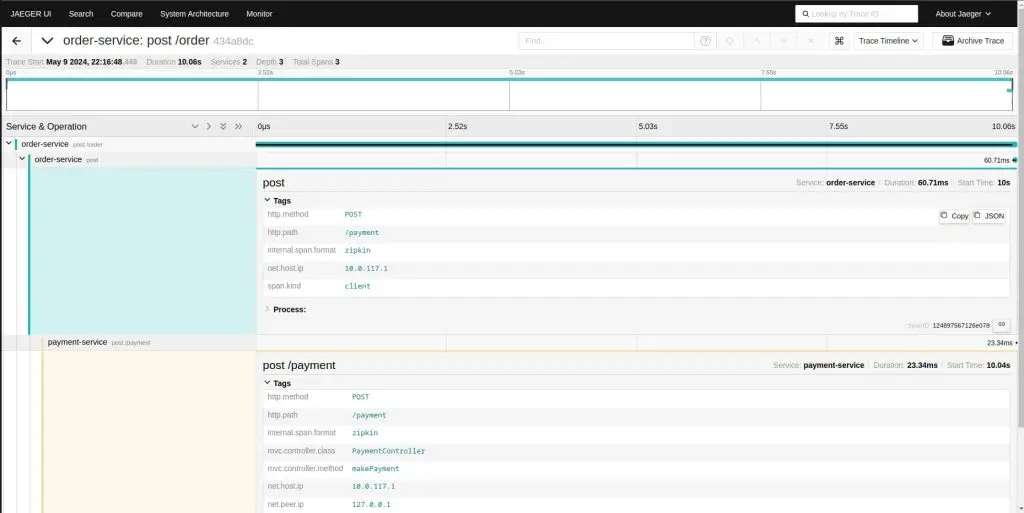
The following picture appears in the Jaeger user interface after I make a few calls using Postman. It shows the default caller information for both of our services. But what if I wish to track every call made to a method? Which process is executing the slowest?
This is where AOP comes into play.
Jaeger UI before AOP integration
AOP configuration for tracing all methods
In both services, we are going to create an aspect that integrates Zipkin tracing into method calls.
					@Aspect
@Component
@RequiredArgsConstructor
public class ZipkinAop {

	private static final String METHOD_NAME = "method.name";

	private final Tracer tracer;

	@Around("execution(public * com.lejdiprifti..*(..))")
	public Object traceAllMethodCalls(ProceedingJoinPoint pJoinPoint) throws Throwable {
		final MethodSignature methodSignature = (MethodSignature) pJoinPoint.getSignature();
		final ScopedSpan span = tracer.startScopedSpan(methodSignature.toShortString());
		if (span != null) {
			span.tag(METHOD_NAME, methodSignature.getName());
		}
		try {
			return pJoinPoint.proceed();
		} catch (Exception exception) {
			if (span != null) {
				span.error(exception);
			}
			throw exception;
		} finally {
			if (span != null) {
				span.finish();
			}
		}
	}
}
@Around is an advice type in Spring AOP that allows the aspect to perform custom behavior around the join point (method execution, in this case).
"execution(public * com.lejdiprifti..*(..))" is a pointcut expression that specifies the methods to which the advice will apply. In this case, it targets all public methods in classes within the package com.lejdiprifti and its subpackages.
MethodSignature extracts metadata about the method being called, such as its name.
tracer.startScopedSpan(methodSignature.toShortString()) starts a new span for the method execution. startScopedSpan creates a new span and associates it with the current thread, allowing automatic propagation of tracing context. The span name is set to the method’s short string representation.
span.tag(METHOD_NAME, methodSignature.getName()) tags the span with the method name, using the constant METHOD_NAME as the key. This is only an example, as we can include other useful information based on the business use case.
Finally, pJoinPoint.proceed() proceeds with the method execution. This line invokes the actual method being intercepted by the aspect.
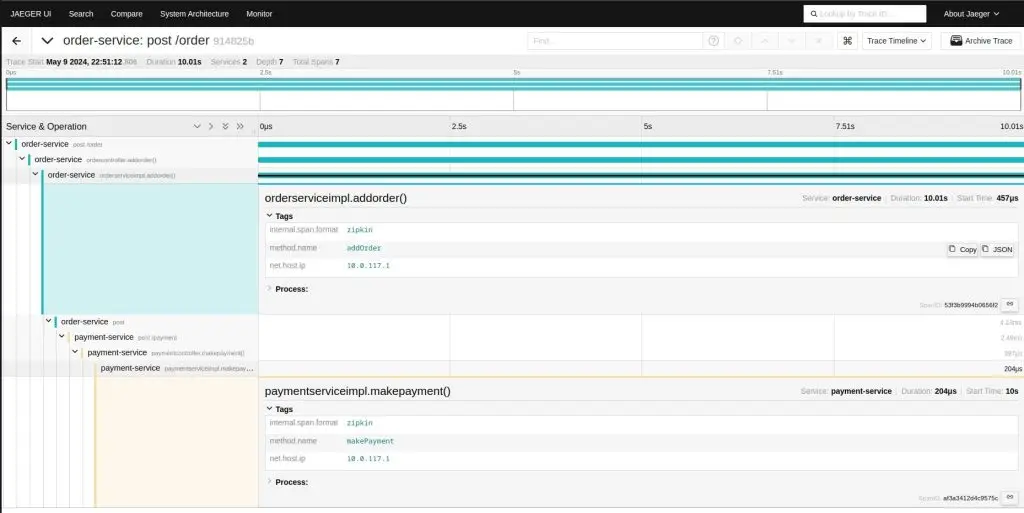
Jaeger UI after AOP integration
Results
After performing a call to the /order endpoint, we can see more information stored in Zipkin (Jaeger). We notice that there is a delay of 10 seconds in the addOrder method. The reason behind that is because there is a thread sleeping.
Thank you!
If you have any comments, feel free to write below.
You really make it seem so easy with your presentation but I find this topic to be really one thing that I feel I might never understand.
It kind of feels too complicated and extremely wide for me.
I’m taking a look forward to your subsequent submit, I will attempt to get the dangle of it!

You really make it seem so easy with your presentation but I find this topic to be really one thing that I feel I might never understand.
It kind of feels too complicated and extremely wide for me.
I’m taking a look forward to your subsequent submit, I will attempt to get the dangle of it!
Very interesting subject, thank you for putting up.